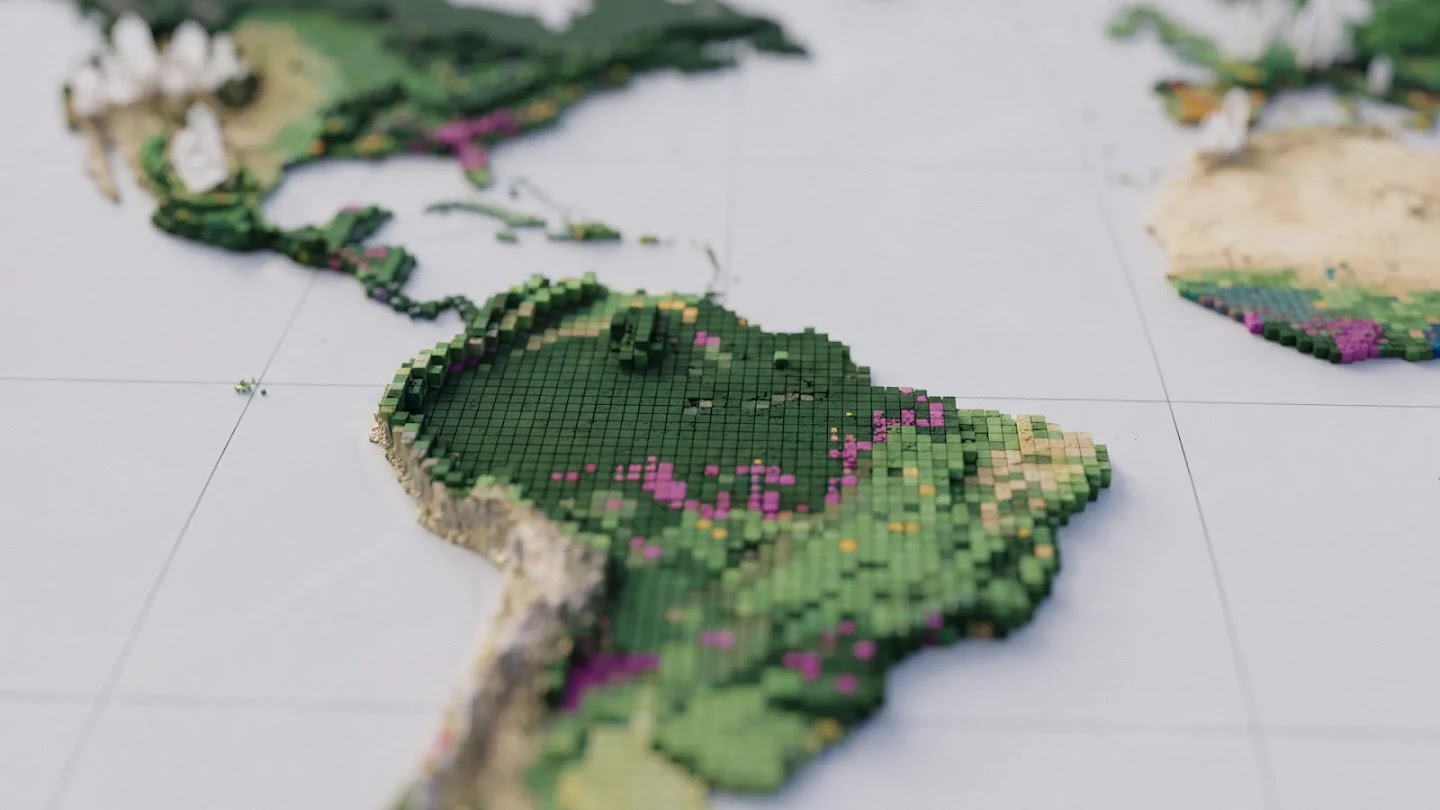
지구의 숲을 보호하려면 간단한 질문부터 시작해야 합니다. 지금 보고 있는 숲은 어떤 유형일까요? 우주에서 보면 오래된 열대우림과 유칼립투스 조림지, 기름야자 농장은 똑같은 녹색 땅처럼 보일 수 있습니다. 하지만 이들이 저장하는 탄소의 양과 생물다양성은 크게 다릅니다. 각 지역을 구분하고 시간이 지나면서 어떻게 변했는지 알면, 보전 활동이 효과를 내는 곳과 자연림이 조림지나 농장으로 바뀌는 곳을 확인할 수 있습니다.
오늘 구글 딥마인드와 구글 리서치는 세계자원연구소(WRI), 국제응용시스템분석연구소(IIASA)와 함께 ‘산림 유형 분류 지도(Forest Typology, ForTy) 2020’를 공개합니다. 이 세계 지도는 지구의 땅을 10미터×10미터 단위로 나누고, 각 구역을 숲과 토지 이용에 관한 6개 유형 가운데 하나로 분류합니다. 이 지도는 유럽연합의 삼림 벌채 규정을 위한 주요 기준 자료입니다. 또한 2017년부터 2025년까지 숲이 해마다 어떻게 달라졌는지 추적하는 초기 시계열 자료도 공개합니다. 여기에는 자연림이 조림지나 농장으로 대체된 곳도 포함됩니다. 전 세계 어디서나 10미터 단위로 해마다 변화를 확인할 수 있는 것은 이번이 처음입니다. 숲이 사라진 곳뿐 아니라 그 자리에 목재 생산용 조림지, 나무 작물 농장 또는 다른 토지가 들어섰는지도 볼 수 있습니다.
‘나무가 있는 곳’만으로는 충분하지 않습니다.
모든 숲은 탄소를 저장하며, 숲은 지구 육지에 사는 식물과 동물 종 대부분의 서식지입니다. 그러나 숲의 생태적 가치는 그 숲이 지나온 과정에도 달려 있습니다. 한 번도 개간되지 않은 원시림은 10~20년마다 벌목되는 단일 수종 목재 조림지보다 훨씬 많은 탄소와 생물다양성을 보유합니다.
세계 지도 대부분은 나무가 있는지 여부만 표시합니다. 자연림을 보호하려는 사람들에게는 이것이 걸림돌이 됩니다. 예를 들어 유럽연합의 삼림 벌채 없는 제품 규정(EUDR)은 커피, 코코아, 팜유 같은 제품이 2020년에 숲이었던 땅에서 생산되고 이후 농지로 바뀐 곳에서 나오지 않도록 요구합니다. 가구 같은 목재 제품도 산림 황폐화와 무관해야 합니다. 즉, 이후 조림지나 식재림으로 바뀐 원시림, 또는 이후 조림지로 바뀐 자연 재생림에서 나온 목재를 사용할 수 없습니다. 따라서 기업과 규제 기관은 나무가 있는 곳뿐 아니라 어떤 유형의 숲인지(원시림인지 다시 자라는 숲인지, 사람이 심은 숲인지 상업용 조림지인지, 숲인지 농장인지), 수확 뒤 그 숲이 무엇으로 바뀌는지도 알아야 합니다.
지난해 우리는 세계의 자연림을 다른 모든 나무가 있는 땅과 구분한 10미터 해상도의 세계 지도인 ‘세계 자연림 2020’을 공동 공개했습니다. 이 지도는 기업과 규제 기관이 유럽연합 삼림 벌채 규정을 이행하고, 상품 생산 기업이 자연림을 다른 용도로 전환하지 않겠다는 약속을 지키도록 돕는 출발점이었습니다. 이 지도는 모든 땅에 대해 한 가지 질문에 답했습니다. 2020년에 자연림이었는가, 아니었는가? ForTy는 여기서 한 걸음 더 나아가 원시림부터 목재 조림지와 나무 작물까지, 그곳에 어떤 유형의 숲이 있는지 보여줍니다. 새로운 시계열 자료를 통해 매년 어떻게 달라지는지도 확인할 수 있습니다.
ForTy의 세계 산림 분류 방식
ForTy는 유엔 식량농업기구(FAO)의 정의를 바탕으로 토지를 다음 6개 유형으로 분류합니다.
원시림: 사람의 교란 흔적이 눈에 띄지 않는 토착림입니다.
자연 재생림: 벌목이나 산불 이후처럼 숲이 자연적으로 다시 자란 곳입니다.
식재림: 사람들이 나무를 심거나 씨앗을 뿌리고, 긴 기간에 걸쳐 관리하는 숲입니다.
조림지: 빠르게 자라는 나무를 집중적으로 관리하는 농장입니다. 대개 한 가지 수종을 기릅니다.
나무 작물 및 혼농임업: 목재가 아닌 기름야자, 고무, 코코아, 과일 등을 재배하는 농지입니다.
기타 토지: 초지와 농경지부터 도시와 물까지 나머지 모든 땅입니다.
이 유형은 땅의 겉모습뿐 아니라 어떻게 이용되는지에 따라 달라지기 때문에 ForTy 모델을 학습시키는 일은 쉽지 않았습니다. 모델이 유형을 구별하도록 전문가 조사, 국가 및 지역별 데이터셋, 모델이 어려움을 겪은 지역에 대한 집중 검토 자료를 모아 약 170만 곳의 위치에 유형을 표시한 대규모 자료를 만들었습니다. 이 모델은 원격탐사 데이터의 특성에 맞춰 설계한 구조를 사용합니다. 주요 입력 자료로는 AlphaEarth Foundations 임베딩을 활용합니다. 임베딩은 각 10미터 픽셀에 대해 여러 해에 걸친 위성 관측을 간결하게 요약한 데이터입니다. 이를 통해 나무를 심은 패턴, 성장 주기, 수확 시기처럼 미묘한 단서를 찾아낼 수 있습니다.
지도의 정확성 검증
사람들이 신뢰할 수 있어야 지도를 쓸 수 있습니다. 그래서 IIASA, WRI와 함께 세계 곳곳에서 무작위로 뽑은 9,000곳이 넘는 지점을 대상으로 ForTy를 검증했습니다. 각 지점에서는 교육을 받은 전문가 두 명이 고해상도 이미지와 여러 해의 위성 기록을 살펴 실제 토지 유형을 판별했습니다. ForTy는 90%의 경우 숲 유형을 정확히 맞혔고, 숲과 비산림 토지를 95%의 정확도로 구분했습니다. 이는 다른 세계 산림 지도보다 나은 결과입니다.
정확도뿐 아니라 세계 각 지역의 보전 방식이 모두 같을 수 없다는 점도 고려했습니다. ForTy는 특정 땅을 ‘예’ 또는 ‘아니요’로만 표시하는 대신, 각 유형에 해당할 확률 점수를 제공합니다. 이에 따라 사용자는 지역 상황과 용도에 맞춰 분류 기준의 정확도와 적용 범위를 조정할 수 있습니다. 예를 들어 EUDR에 따라 삼림 벌채 위험을 평가하는 기업은 규제 위험을 피하기 위해 모델의 확신도가 높은 픽셀만 인정하는 엄격한 기준을 설정할 수 있습니다. 반면 전체 산림 면적을 추정하는 연구자는 여러 확률을 모두 활용해 가능한 토지 분포를 더 폭넓게 파악할 수 있습니다.
한 시점의 지도에서 변화의 기록으로
한 해의 지도는 유용한 기준 자료지만 숲은 변합니다. 새로 공개하는 초기 시계열 자료는 비슷한 방법을 2017년부터 2025년까지 매년 적용합니다. 숲이 사라지거나 다시 자라는 곳뿐 아니라 어떤 변화가 일어났는지도 보여줍니다. 예를 들어 자연림이 목재 조림지로 바뀌거나, 버려진 땅에서 숲이 서서히 다시 자라는 경우를 확인할 수 있습니다.
이런 구분이 중요한 이유는 우주에서 알아보기 어려운 변화도 있기 때문입니다. 자연림을 벌목한 뒤 조림지로 다시 조성하면 땅은 곧 다시 푸르게 보입니다. 그래서 일반적인 나무 분포 지도는 이런 변화를 포착하지 못할 수 있습니다. ForTy 시계열 자료는 산림의 감소와 증가 모두에서 이러한 숨은 변화를 드러냅니다.
앞으로의 계획
‘산림 유형 분류 2020’ 지도(Scientific Data에 소개됨)와 새 시계열 자료는 오픈 라이선스로 구글 어스 엔진에서 무료로 이용할 수 있습니다. 정부와 기업, 보전 단체, 과학자들이 이를 활용해 삼림 벌채 없는 공급망을 구축하고, 필요한 곳에 산림 재원을 지원하며, 가장 중요한 자연림을 보호하기를 바랍니다. 앞으로 몇 달 동안 파트너와 사용자들과 함께 시계열 자료를 계속 개선할 예정이며, 여러분이 이 자료를 어떻게 활용하는지도 듣고 싶습니다. ForTy는 자연을 위한 AI 연구 포트폴리오의 일부입니다. 이 포트폴리오에는 산림 손실의 원인 지도화, 삼림 벌채 위험 예측, 세계 생물종 분포 모델링, 현장 생물다양성 모니터링이 포함됩니다. FortTy는 지구의 가장 중요한 환경 문제를 해결하도록 설계된 구글의 지리공간 모델 및 데이터셋 모음인 Google Earth AI에도 새로 추가됐습니다.
감사의 말
이 연구는 구글 딥마인드와 구글 리서치가 세계자원연구소 및 국제응용시스템분석연구소와 공동 개발했습니다. 공동 저자인 Anton Raichuk, Peter Potapov, Myroslava Lesiv, Matthew Overlan, Mélanie Rey, Ravindran Rajakumar, Michelangelo Conserva, Radost Stanimirova, Michelle Sims, Sarah Carter, Elizabeth Goldman, Yuchang Jiang, Linus Scheibenreif, Ivelina Georgieva, Maria Shchepashchenko, Steffen Fritz, Nicholas Clinton, Dan Morris, Drew Purves와 지도를 개선하는 데 도움을 준 신뢰할 수 있는 테스터들에게 감사드립니다.
영어 원문
Beyond tree cover: mapping the world’s forest types
A new 10-meter resolution map shows which of the world's forests are natural, planted, or farmed, and how they are changing over time
Protecting the planet's forests starts with a simple question: what type of forest are we looking at? From space, an old-growth rainforest, a eucalyptus plantation, and an oil palm estate can look like the same patch of green. But they hold very different amounts of carbon and biodiversity. Telling them apart, and knowing how each patch has changed over time, shows us where conservation is working and where natural forests are being converted into plantations and farms.
Today, Google DeepMind and Google Research, together with the World Resources Institute (WRI) and the International Institute for Applied Systems Analysis (IIASA), are releasing Forest Typology (ForTy) 2020, a global map that categorizes every 10-by-10-meter patch of land on Earth into six distinct forest and land-use types, a key baseline for the EU's deforestation regulation. Alongside it, we're sharing an early time series that tracks how these forests changed each year from 2017 to 2025, including where natural forests were replaced by plantations or farms. For the first time, users can see at 10-meter detail worldwide, year by year, not just where forest was lost, but what replaced it: a timber plantation, a tree-crop farm or other land.
Why "tree cover" isn't enough
All forests store carbon and, together, forests are home to most of the world's land-based plant and animal species. But a forest’s ecological value also depends on its history: a primary forest that has never been cleared holds far more carbon and biodiversity than a single-species timber plantation that is harvested every decade or two.
Most global maps only indicate whether trees are present. That's a challenge for those trying to protect natural forests. The European Union's regulation on deforestation-free products (EUDR), for example, requires that products like coffee, cocoa or palm oil do not originate from land that was forest in 2020 and has since been converted to agriculture. Similarly, wood products, such as furniture, must also be free of forest degradation: they can't come from primary forests that have since been converted into plantation or planted forests, or from naturally regenerating forests that have since been converted into plantation forests. As a result, companies and regulators need to know not just where trees are, but what kind of forest they form (primary or regrowing, planted or plantation, forest or farm) and what replaces that forest after a harvest.
Last year, we jointly released Natural Forests of the World 2020, a 10-meter resolution global map that separated natural forests from all other tree cover. It offered a starting point to help companies and regulators implement the EU Deforestation Regulation, and to support commodity producers in meeting their commitments not to convert natural forest. That map answered one question for every patch of land: was it natural forest in 2020 or not? ForTy goes further, showing what kind of forest is there, from primary forest to timber plantation to tree crops, and, with the new time series, how that changes each year.
How ForTy classifies the world's forests
Specifically, ForTy sorts land into six categories based on definitions from the UN Food and Agriculture Organization (FAO):
Primary forest: native forest with no visible signs of human disturbance.
Naturally regenerating forest: forest that grew back on its own, for example after logging or fire.
Planted forest: forest that people planted or seeded, and managed over long cycles.
Plantation forest: fast-growing, intensively managed tree farms, often of one species.
Tree crops and agroforestry: farms that grow things other than wood, like oil palm, rubber, cocoa, or fruit.
Other land: everything else, from grassland and cropland to cities and water.
Training our ForTy model was challenging because these categories depend in part on how land is used, not just how it looks. To teach our model the difference, we built a large-scale collection of forest-type examples with about 1.7 million labeled locations drawn from expert surveys, national and regional datasets, and targeted reviews of places where the model struggled. The model uses a custom architecture designed for the challenges of remote sensing data, and takes as a key input AlphaEarth Foundations embeddings, data-compact summaries of years of satellite observations for each 10-meter pixel, so it can spot subtle clues like planting patterns, growth cycles and harvest rhythms.
Putting the map to the test
A map is only useful if people can trust it. So, with IIASA and WRI, we validated ForTy against more than 9,000 randomly chosen sites around the world. At each site, two trained experts studied high-resolution imagery and years of satellite records to determine which type of land was really there. ForTy picked the right forest type 90% of the time, and told forest apart from non-forest land 95% of the time, outperforming other global forest maps.
Beyond accuracy, we know that global conservation is not one-size-fits-all. Instead of giving a yes-or-no label for a specific patch of land, ForTy provides a probability score for each class, enabling users to adapt the classification to regional contexts and application-specific precision trade-offs. For example, a company assessing deforestation risk under EUDR might set a strict threshold, only accepting pixels the model is highly certain about to avoid regulatory risks. Meanwhile, a researcher estimating total forest extent might use the full spectrum of probabilities to get a fuller picture of the potential landscape.
From a single snapshot in time to a story of change
A map of a single year is a useful baseline, but forests change. Our new early-release time series applies a similar approach to every year from 2017 to 2025. It shows not only where forests disappear and where they grow back, but also what kind of change happened: a natural forest turned into a timber plantation, for example, or abandoned land slowly regenerating into forest.
This differentiation matters because some of the most important changes are hard to see from space. When a natural forest is logged and replanted as a plantation, the land soon looks green again, so standard tree-cover maps might not pick up the change. ForTy's time series makes these hidden changes visible, both losses and gains.
What's next
The Forest Typology 2020 map [described in Scientific Data] and the new time series are now freely available on Google Earth Engine under an open license. We hope governments, companies, conservation groups and scientists will use them to help build deforestation-free supply chains, direct forest finance where it’s needed, and protect the natural forests that matter most. Over the coming months, we'll keep improving the time series with our partners and users, and we'd love to hear how you use it. ForTy is part of our portfolio of research on AI for Nature, which includes mapping the drivers of forest loss, forecasting deforestation risk, modelling global species distributions, and monitoring biodiversity in the field. FortTy is also the latest addition to Google Earth AI, Google’s collection of geospatial models and datasets designed to help tackle the planet's most critical environmental challenges.
Acknowledgements
This work was co-developed by Google DeepMind and Google Research, with the World Resources Institute and the International Institute for Applied Systems Analysis. We'd like to thank our co-authors Anton Raichuk, Peter Potapov, Myroslava Lesiv, Matthew Overlan, Mélanie Rey, Ravindran Rajakumar, Michelangelo Conserva, Radost Stanimirova, Michelle Sims, Sarah Carter, Elizabeth Goldman, Yuchang Jiang, Linus Scheibenreif, Ivelina Georgieva, Maria Shchepashchenko, Steffen Fritz, Nicholas Clinton, Dan Morris and Drew Purves, as well as the trusted testers who helped improved the map.